〇〇言語なんて今は使われていないよ!
今は〇〇言語が流行っているよ!
…とかいうブラジリアン柔術的なマウンティング・コミュニケーションがよく行われますが、実際のところ、その数値的な背景を聞くことは少ないです。
今回は人気サイトのStackOverflowで、特定の言語が、特定の期間で、どのくらい質問が発生したかをしらべてみて、いくつかのプログラミング言語のトレンドを見てみようと思います。
StackOverflowのAPIを使う。
StackOverflowにはAPIが公開されています。
https://api.stackexchange.com/docs
登録方法やアクセストークンの取りかたは、以下のページを参考にしました。
StackOverflowのAPIを試してみる
https://qiita.com/yoichiro6642/items/a951178fbd2d82256d68
アクセストークンがなくても300回はリクエストできますが、すぐ切れるので登録しておいたほうがいいと思います。
特定のタグの質問をDBに取り込む
StackOverflowのAPIは1日1万回程度の上限があるので、一旦、DBに格納します。
以下のプログラムは特定のタグを作成日順にソートして取得するものになります。
stackoverflow_create.py
import http.client
import json
import sys
import gzip
import time

import stackoverflow_setting

args = sys.argv
if len(args) != 5:
    print(u'python stackoverflow.py start_page tag access_token application_key')
    exit(1)
start_page = args[1]
tag = args[2]
access_token = args[3]
appkey = args[4]

stackoverflow_setting.connectDb(tag)
from stackoverflow_db import *
stackoverflow_setting.db.create_tables([Questions, TagRelations])

item_ids = []
error_cnt = 0

def query(conn, tag, page):
    api = "/2.2/questions?access_token=" + access_token + "&tagged=" + tag + "&sort=creation&order=asc&page=" + str(page) + "&pagesize=100&site=stackoverflow&key=" + appkey
    print(api)
    global error_cnt
    try:
        conn.request("GET", api)
        res = conn.getresponse()
        if (res.status != 200):
            raise Exception(res.status, res.reason)
    except Exception:
        if error_cnt == 2:
            raise Exception
        error_cnt = error_cnt + 1
        time.sleep(5)
        conn.close()
        conn = http.client.HTTPSConnection("api.stackexchange.com", 443)
        return query(conn, tag, page)
    data = res.read()
    data = gzip.decompress(data)
    jsondata = json.loads(data)
    error_cnt = 0
    return jsondata['items']

def convertToDb(items):
    result_items = []
    tags = []
    for i in items:
        if i['question_id'] in item_ids:
            continue
        item_ids.append(i['question_id'])
        r = {
            'question_id': i['question_id'],
            'view_count': i['view_count'],
            'answer_count': i['answer_count'],
            'score': i['score'],
            'title': i['title'],
            'link': i['link'],
            'last_activity_date': i['last_activity_date'],
            'creation_date': i['creation_date']
        }
        result_items.append(r)
        for t in i['tags']:
            tags.append({'name': t, 'question_id': i['question_id']})
    return result_items, tags

conn = http.client.HTTPSConnection("api.stackexchange.com", 443)
page = int(start_page)
while True:
    questions = query(conn, tag, page)
    questions, tags = convertToDb(questions)
    if (len(questions) == 0):
        break
    with stackoverflow_setting.db.transaction():
        Questions.insert_many(questions).execute()
        TagRelations.insert_many(tags).execute()
    page = page + 1

conn.close()
stackoverflow_setting.db.close()
stackoverflow_setting.py
from peewee import *

db = None

def connectDb(tag):
    global db
    db = SqliteDatabase('stackoverflow_' + tag + '.sqlite3')
stackoverflow_db.py
from peewee import *
import dateutil.parser
from dateutil.relativedelta import relativedelta
from datetime import datetime, date, timedelta
import time
import stackoverflow_setting

class Questions(Model):
    question_id = CharField(primary_key=True)
    view_count = IntegerField(null=True)
    answer_count = IntegerField(null=True)
    score = IntegerField(null=True)
    link = CharField(null=True)
    title = CharField(null=True)
    last_activity_date = DateTimeField(null=True)
    creation_date = DateTimeField(null=True, index=True)

    class Meta:
        database = stackoverflow_setting.db

class TagRelations(Model):
    name = CharField()
    question_id = CharField()

    class Meta:
        database = stackoverflow_setting.db
        primary_key = CompositeKey('name', 'question_id')

def getMonthHistogram(start_date, end_date, interval):
    start_date = dateutil.parser.parse(start_date)
    end_date = dateutil.parser.parse(end_date)
    ret = []
    tmp_from_date = start_date
    tmp_to_date = tmp_from_date + relativedelta(months=interval)
    while tmp_from_date <= end_date:
        data = (
            tmp_from_date.strftime('%Y-%m'),
            Questions.select().where(
                (Questions.creation_date >= tmp_from_date.timestamp()) &
                (Questions.creation_date < tmp_to_date.timestamp())
            ).count()
        )
        ret.append(data)
        tmp_from_date = tmp_from_date + relativedelta(months=interval)
        tmp_to_date = tmp_to_date + relativedelta(months=interval)
    return ret
使い方は以下のようになります。
# 例 1ページ目からvbaのタグが付いている質問をとる
python stackoverflow_create.py 1 vba アクセストークン クライアントアプリのキー

# 例 2088ページ目からC#のタグが付いている質問をとる
python stackoverflow_create.py 2088 c# アクセストークン クライアントアプリのキー
pythonとかjavascriptとかを取得すると当然の権利のように1万リクエストを超えるので、2日以上かけて取得する必要があります。
特定期間の質問数を検索する。
作成したDBから特定期間の質問数がいくつあったかを調べるスクリプトは以下のようになります。
stackoverflow_hist.py
import sys
import codecs
import stackoverflow_setting
import matplotlib.pyplot as plt

args = sys.argv
if len(args) != 5:
    print(u'python stackoverflowhist.py tag 2008-1-1 2019-6-1 6')
    exit(1)
tag = args[1]

stackoverflow_setting.connectDb(tag)

from stackoverflow_db import *
results = getMonthHistogram(args[2], args[3], int(args[4]))
x = []
y = []
label = []
i = 1
for ret in results:
    print("%s\t%s" % (ret[0], ret[1]))
    if i == 1 or i == len(results):
        label.append(ret[0])
    else:
        label.append('')
    y.append(ret[1])
    x.append(i)
    i = i + 1
plt.bar(x, y)
plt.xticks(x, label)
plt.show()
stackoverflow_setting.db.close()
使い方の例は以下のようになります。
# 2008/6/1~2019-5-31まで12か月単位でjavascriptの検索数を調べる
python stackoverflow_hist.py javascript 2008-6-1 2019-5-31 12
色々集計してみる
2008年6月~2019年5月に作成されたデータを基に色々集計してみます。
対象はjavascript,python,vba,vbscript,wsh,powershellでやってみます。
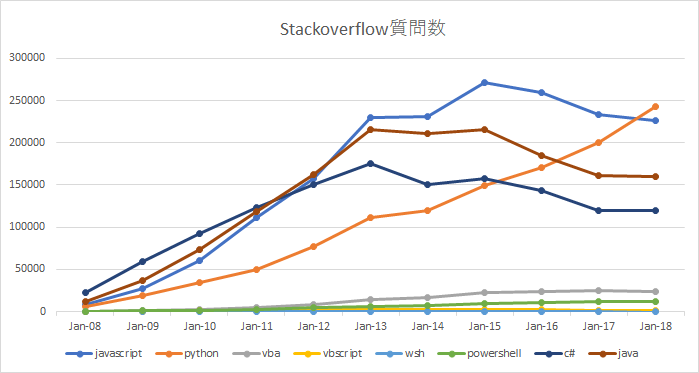
| javascript | python | vba | vbscript | wsh | powershell | c# | java | |
|---|---|---|---|---|---|---|---|---|
| Jun-08 | 7951 | 5859 | 631 | 355 | 51 | 389 | 22474 | 11453 |
| Jun-09 | 27921 | 18803 | 1689 | 633 | 68 | 876 | 58992 | 36601 |
| Jun-10 | 60941 | 33862 | 2575 | 948 | 78 | 1540 | 93063 | 73095 |
| Jun-11 | 110921 | 49546 | 4334 | 1348 | 116 | 2752 | 123462 | 118936 |
| Jun-12 | 157764 | 77398 | 8218 | 2104 | 136 | 4444 | 150648 | 162733 |
| Jun-13 | 230173 | 111358 | 14654 | 2600 | 129 | 6463 | 175102 | 215847 |
| Jun-14 | 231230 | 119682 | 17026 | 2408 | 113 | 7774 | 150981 | 210787 |
| Jun-15 | 271217 | 149880 | 22415 | 2372 | 120 | 9647 | 157980 | 215667 |
| Jun-16 | 259393 | 170602 | 24120 | 1873 | 99 | 10930 | 142999 | 185500 |
| Jun-17 | 233279 | 200035 | 24897 | 1520 | 57 | 11417 | 120097 | 161678 |
| Jun-18 | 226486 | 242475 | 23581 | 1105 | 37 | 12488 | 120278 | 160181 |
総数だけでみるとjavascript,python,java,C#とvba,wsh,vbscrip,powershellの差が大きいです。
数値の遷移としてはjavascript,python,javaは同様の動きをしています。
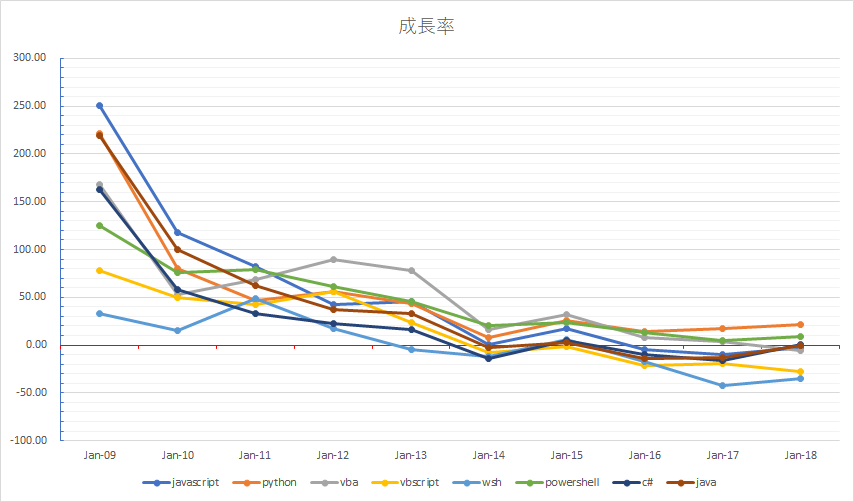
次に「(前年-当年)/前年 × 100」で成長率を表示してみます。
| javascript | python | vba | vbscript | wsh | powershell | c# | java | |
|---|---|---|---|---|---|---|---|---|
| Jun-09 | 251.16 | 220.93 | 167.67 | 78.31 | 33.33 | 125.19 | 162.49 | 219.58 |
| Jun-10 | 118.26 | 80.09 | 52.46 | 49.76 | 14.71 | 75.80 | 57.76 | 99.71 |
| Jun-11 | 82.01 | 46.32 | 68.31 | 42.19 | 48.72 | 78.70 | 32.66 | 62.71 |
| Jun-12 | 42.23 | 56.21 | 89.62 | 56.08 | 17.24 | 61.48 | 22.02 | 36.82 |
| Jun-13 | 45.90 | 43.88 | 78.32 | 23.57 | -5.15 | 45.43 | 16.23 | 32.64 |
| Jun-14 | 0.46 | 7.47 | 16.19 | -7.38 | -12.40 | 20.28 | -13.78 | -2.34 |
| Jun-15 | 17.29 | 25.23 | 31.65 | -1.50 | 6.19 | 24.09 | 4.64 | 2.32 |
| Jun-16 | -4.36 | 13.83 | 7.61 | -21.04 | -17.50 | 13.30 | -9.48 | -13.99 |
| Jun-17 | -10.07 | 17.25 | 3.22 | -18.85 | -42.42 | 4.46 | -16.02 | -12.84 |
| Jun-18 | -2.91 | 21.22 | -5.29 | -27.30 | -35.09 | 9.38 | 0.15 | -0.93 |
成長率がプラスをキープしているのはpythonとpowershellです。
意外なことにjavascriptは3年連続マイナス成長。とはいえ元の数が大きいのでまだまだ健在でしょう。
vbaは直近1年がマイナスなだけで、総数は少ないものの意外と元気です。
wshとvbscriptは10%以上のマイナス成長を続けています。

10年前から人気がないとか言ってはいけない
今やるならPowerShellをやったほうがいいでしょう。
javascript詳細
| 期間 | 質問数 |
|---|---|
| 2008-06 | 7951 |
| 2009-06 | 27921 |
| 2010-06 | 60941 |
| 2011-06 | 110921 |
| 2012-06 | 157764 |
| 2013-06 | 230173 |
| 2014-06 | 231230 |
| 2015-06 | 271217 |
| 2016-06 | 259393 |
| 2017-06 | 233279 |
| 2018-06 | 226486 |
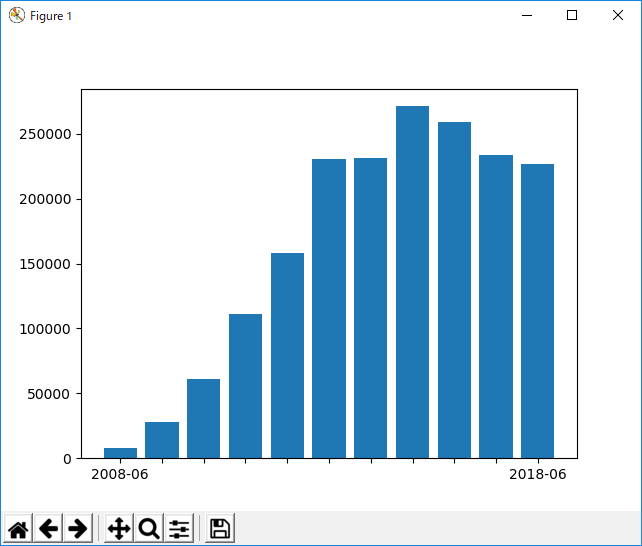
2015年~2016年をピークに頭打ちですが、いまでも一年で20万件は検索されています。
前半部はjavascriptの人気があがったというより、StackOverflowの人気が上がったということだと思います。
なお、同時に着けられたタグのトップ30は以下のようになります。
使用SQL
select name, count(name) as cnt from tagrelations group by name order by cnt desc| タグ | 数 |
|---|---|
| jquery | 530487 |
| html | 334424 |
| css | 153873 |
| angularjs | 117362 |
| php | 115413 |
| node.js | 101428 |
| ajax | 91324 |
| reactjs | 63514 |
| json | 61099 |
| arrays | 54661 |
| html5 | 53401 |
| asp.net | 32122 |
| regex | 29810 |
| angular | 28283 |
| twitter-bootstrap | 24911 |
| c# | 24187 |
| forms | 22946 |
| d3.js | 22164 |
| google-chrome | 22144 |
| typescript | 22071 |
| dom | 20409 |
| google-maps | 18990 |
| java | 18280 |
| express | 17844 |
| canvas | 17640 |
| ecmascript-6 | 16592 |
| function | 15535 |
| object | 15535 |
| vue.js | 15321 |
| android | 14983 |
python詳細
| 期間 | 質問数 |
|---|---|
| 2008-06 | 5859 |
| 2009-06 | 18803 |
| 2010-06 | 33862 |
| 2011-06 | 49546 |
| 2012-06 | 77398 |
| 2013-06 | 111358 |
| 2014-06 | 119682 |
| 2015-06 | 149880 |
| 2016-06 | 170602 |
| 2017-06 | 200035 |
| 2018-06 | 242475 |
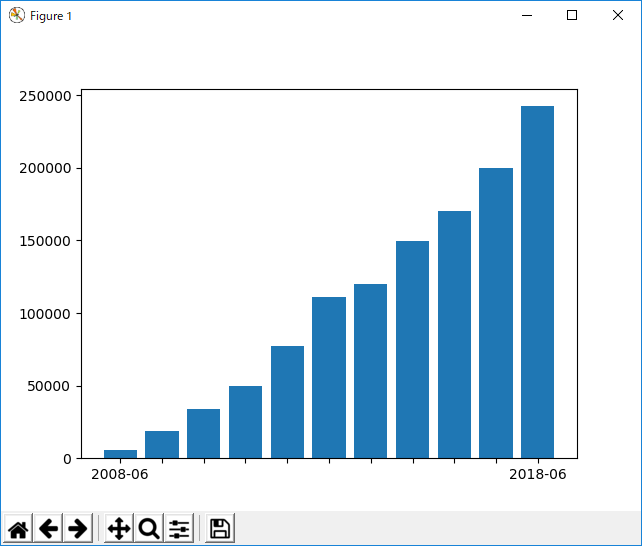
質問数が右肩上がりです。
2018~2019でついにJavaScript越えを果たしました。
同時に着けられたタグのトップ30は以下のようになります。
| タグ | 数 |
|---|---|
| django | 101189 |
| python-3.x | 100255 |
| pandas | 92483 |
| python-2.7 | 58871 |
| numpy | 54335 |
| list | 37161 |
| matplotlib | 33047 |
| dictionary | 26463 |
| dataframe | 25322 |
| regex | 24182 |
| flask | 22056 |
| tensorflow | 21907 |
| tkinter | 21646 |
| string | 19524 |
| csv | 19327 |
| arrays | 18897 |
| json | 17186 |
| selenium | 14538 |
| html | 13503 |
| beautifulsoup | 13329 |
| opencv | 12718 |
| mysql | 12353 |
| scipy | 12109 |
| machine-learning | 11968 |
| google-app-engine | 11727 |
| scikit-learn | 11333 |
| linux | 11237 |
| sqlalchemy | 11041 |
| web-scraping | 10943 |
| multithreading | 10762 |
vba詳細
| 期間 | 質問数 |
|---|---|
| 2008-06 | 631 |
| 2009-06 | 1689 |
| 2010-06 | 2575 |
| 2011-06 | 4334 |
| 2012-06 | 8218 |
| 2013-06 | 14654 |
| 2014-06 | 17026 |
| 2015-06 | 22415 |
| 2016-06 | 24120 |
| 2017-06 | 24897 |
| 2018-06 | 23581 |
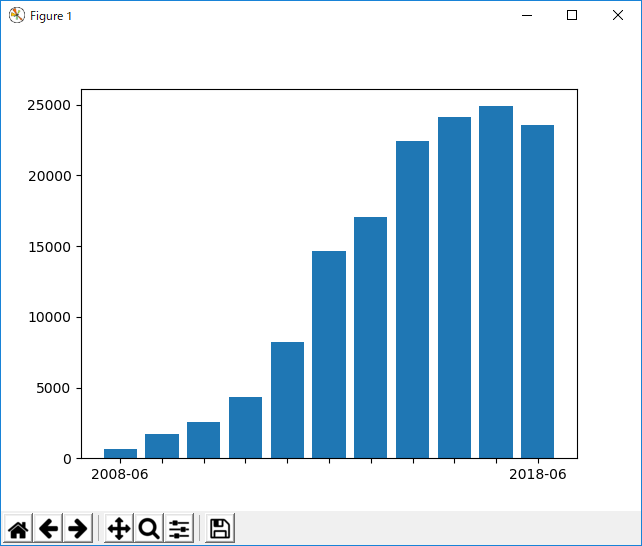
javascriptの10分の1程度の質問数であるのは想定通りとして、質問数の年毎の遷移が余り変わっていないということです。
つまり、まだだ、まだVBAはたおれんよ!
同時に着けられたタグのトップ30は以下のようになります。
| タグ | 数 |
|---|---|
| excel | 109286 |
| excel-vba | 80136 |
| ms-access | 9588 |
| access-vba | 5445 |
| ms-word | 4343 |
| outlook | 3674 |
| excel-formula | 3626 |
| sql | 3424 |
| arrays | 2869 |
| word-vba | 2845 |
| excel-2010 | 2595 |
| outlook-vba | 2316 |
| loops | 2282 |
| userform | 1797 |
| powerpoint | 1620 |
| excel-2007 | 1482 |
| html | 1449 |
| range | 1307 |
| macros | 1256 |
| ms-access-2010 | 1233 |
| web-scraping | 1229 |
| powerpoint-vba | 1164 |
| vbscript | 1115 |
| 1104 | |
| c# | 1092 |
| if-statement | 1072 |
| pivot-table | 1043 |
| sql-server | 1022 |
| date | 1017 |
| combobox | 984 |
vbscript詳細
| 期間 | 数 |
|---|---|
| 2008-06 | 355 |
| 2009-06 | 633 |
| 2010-06 | 948 |
| 2011-06 | 1348 |
| 2012-06 | 2104 |
| 2013-06 | 2600 |
| 2014-06 | 2408 |
| 2015-06 | 2372 |
| 2016-06 | 1873 |
| 2017-06 | 1520 |
| 2018-06 | 1105 |
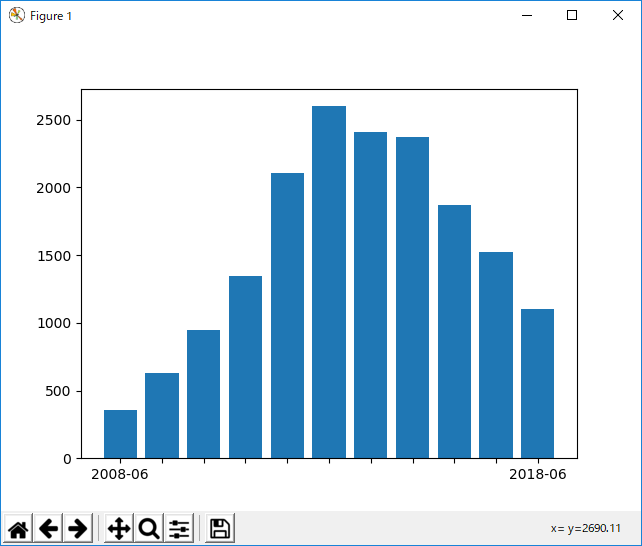
いやいや・・・WSHでタグ付けされている可能性もあるですし・・・
| タグ | 数 |
|---|---|
| asp-classic | 2161 |
| excel | 1368 |
| vba | 1134 |
| batch-file | 1120 |
| windows | 910 |
| javascript | 656 |
| excel-vba | 608 |
| qtp | 534 |
| html | 532 |
| c# | 434 |
| xml | 421 |
| wsh | 419 |
| hta | 417 |
| sql | 403 |
| powershell | 391 |
| regex | 379 |
| hp-uft | 346 |
| cmd | 344 |
| wmi | 290 |
| scripting | 289 |
| vb.net | 282 |
| sql-server | 280 |
| arrays | 267 |
| internet-explorer | 229 |
| outlook | 229 |
| asp.net | 224 |
| csv | 211 |
| com | 203 |
| ms-access | 196 |
| automation | 179 |
wsh詳細
| 期間 | 数 |
|---|---|
| 2008-06 | 51 |
| 2009-06 | 68 |
| 2010-06 | 78 |
| 2011-06 | 116 |
| 2012-06 | 136 |
| 2013-06 | 129 |
| 2014-06 | 113 |
| 2015-06 | 120 |
| 2016-06 | 99 |
| 2017-06 | 57 |
| 2018-06 | 37 |
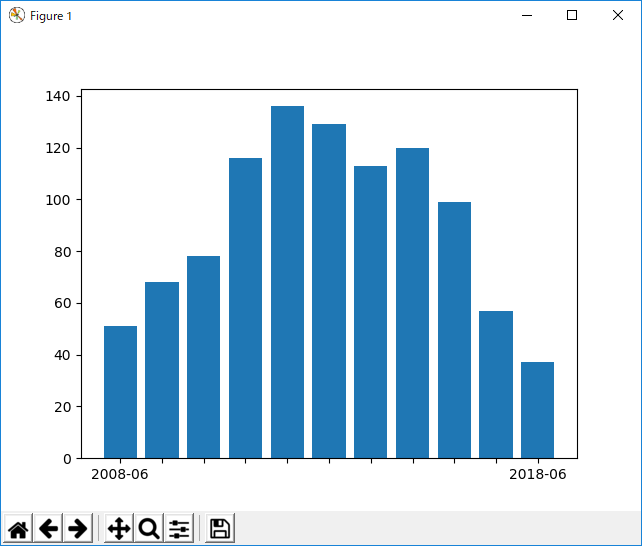
2008年より下回っているじゃないかたまげたなぁ。
| タグ | 数 |
|---|---|
| vbscript | 419 |
| javascript | 165 |
| jscript | 161 |
| windows | 137 |
| batch-file | 64 |
| php | 45 |
| vba | 45 |
| powershell | 44 |
| cmd | 43 |
| excel | 40 |
| scripting | 38 |
| c# | 36 |
| windows-scripting | 35 |
| com | 34 |
| shell | 31 |
| hta | 28 |
| wso2 | 27 |
| activex | 24 |
| excel-vba | 21 |
| internet-explorer | 20 |
| command-line | 18 |
| registry | 18 |
| html | 16 |
| python | 16 |
| c++ | 14 |
| sendkeys | 14 |
| scheduled-tasks | 13 |
| wmi | 12 |
| activexobject | 11 |
| asp-classic | 11 |
powershell詳細
| 期間 | 数 |
|---|---|
| 2008-06 | 389 |
| 2009-06 | 876 |
| 2010-06 | 1540 |
| 2011-06 | 2752 |
| 2012-06 | 4444 |
| 2013-06 | 6463 |
| 2014-06 | 7774 |
| 2015-06 | 9647 |
| 2016-06 | 10930 |
| 2017-06 | 11417 |
| 2018-06 | 12488 |
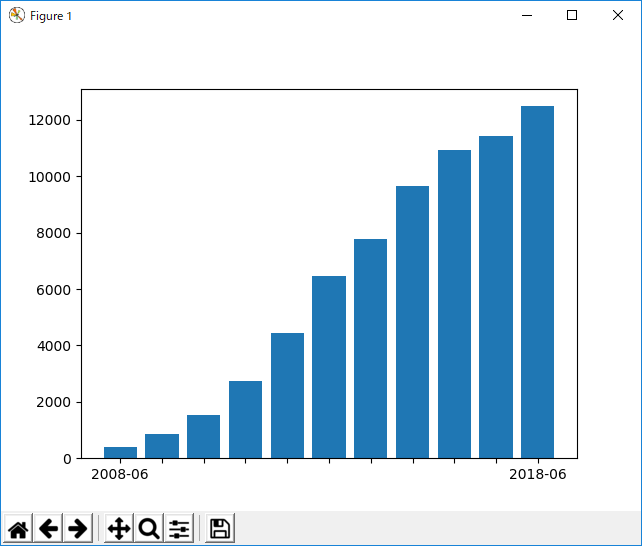
総数的にはVBAには届かないものの、右肩上がりなので成長性はあると思います。vbscriptなんていらんかったんや。。。
| タグ | 数 |
|---|---|
| windows | 4389 |
| c# | 3142 |
| powershell-v2.0 | 3142 |
| azure | 2857 |
| active-directory | 2219 |
| csv | 2212 |
| powershell-v3.0 | 2115 |
| batch-file | 1767 |
| regex | 1523 |
| .net | 1494 |
| xml | 1357 |
| arrays | 1296 |
| scripting | 1198 |
| sql-server | 1196 |
| cmd | 1150 |
| powershell-v4.0 | 1085 |
| excel | 967 |
| sharepoint | 831 |
| exchange-server | 769 |
| python | 751 |
| powershell-remoting | 741 |
| string | 693 |
| wmi | 667 |
| json | 664 |
| sql | 653 |
| iis | 595 |
| powershell-v5.0 | 534 |
| tfs | 530 |
| variables | 516 |
| azure-powershell | 515 |
c#詳細
| 期間 | 質問数 |
|---|---|
| Jun-08 | 22474 |
| Jun-09 | 58992 |
| Jun-10 | 93063 |
| Jun-11 | 123462 |
| Jun-12 | 150648 |
| Jun-13 | 175102 |
| Jun-14 | 150981 |
| Jun-15 | 157980 |
| Jun-16 | 142999 |
| Jun-17 | 120097 |
| Jun-18 | 120278 |
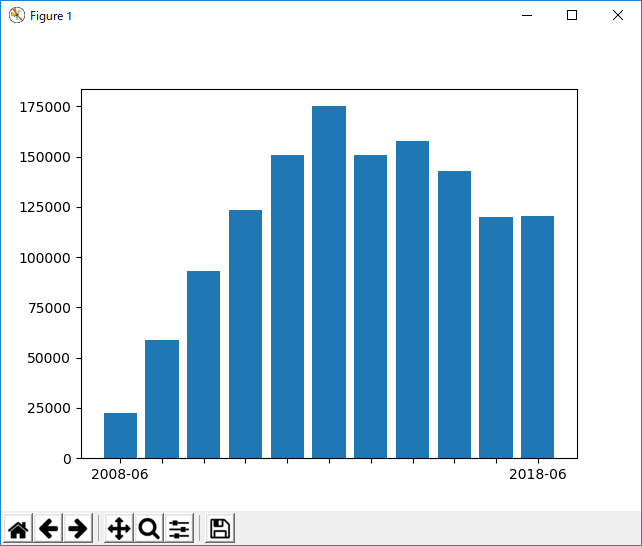
傾向としてはjavascriptと同じような動きをしています。
あと、他のタグとの関連性にasp.net-mvcが上位に食い込んできたのは意外でした。
| タグ | 数 |
|---|---|
| .net | 175846 |
| asp.net | 159596 |
| wpf | 90093 |
| asp.net-mvc | 70512 |
| winforms | 68023 |
| linq | 55997 |
| entity-framework | 46230 |
| xaml | 32100 |
| sql-server | 30717 |
| sql | 28984 |
| visual-studio | 28121 |
| xml | 25926 |
| javascript | 24200 |
| wcf | 22112 |
| unity3d | 21815 |
| multithreading | 21341 |
| json | 19774 |
| jquery | 16357 |
| regex | 15650 |
| asp.net-mvc-4 | 15609 |
| asp.net-web-api | 14805 |
| asp.net-core | 13992 |
| windows | 13887 |
| generics | 13546 |
| visual-studio-2010 | 13492 |
| string | 13428 |
| arrays | 13423 |
| xamarin | 13396 |
| mvvm | 13338 |
| datagridview | 12924 |
java詳細
| 期間 | 質問数 |
|---|---|
| Jun-08 | 11453 |
| Jun-09 | 36601 |
| Jun-10 | 73095 |
| Jun-11 | 118936 |
| Jun-12 | 162733 |
| Jun-13 | 215847 |
| Jun-14 | 210787 |
| Jun-15 | 215667 |
| Jun-16 | 185500 |
| Jun-17 | 161678 |
| Jun-18 | 160181 |
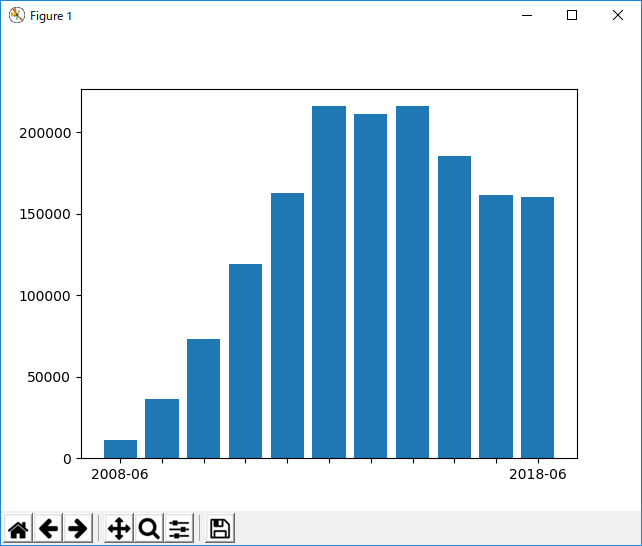
このグラフの形はコピペミスかとビビる。C#と同じ傾向っすね。
ただ、他のタグとの関連としてandroidが圧倒的な一位ということは他の言語でandroid開発が可能になってきた後どうなるかは気になります。
| タグ | 数 |
|---|---|
| android | 232060 |
| spring | 91000 |
| swing | 71641 |
| eclipse | 54432 |
| hibernate | 47824 |
| arrays | 41285 |
| maven | 35411 |
| multithreading | 33980 |
| xml | 31989 |
| json | 31063 |
| spring-boot | 27971 |
| spring-mvc | 27854 |
| string | 27653 |
| jsp | 26005 |
| mysql | 25968 |
| jpa | 23074 |
| servlets | 21815 |
| arraylist | 21692 |
| tomcat | 20904 |
| regex | 20575 |
| jdbc | 19291 |
| javafx | 18894 |
| javascript | 18303 |
| java-ee | 16452 |
| selenium | 16107 |
| rest | 15977 |
| sql | 15005 |
| generics | 14791 |
| web-services | 13930 |
| junit | 13920 |
まとめ
StackOverflowの質問数の遷移で各言語のトレンドを見てみました。
感覚的にはPythonやVbScriptなどは数値に違和感はありませんでしたが、Vbaの質問頻度が下がっていないのは意外でした。
なお、JavaとかRubyとか人気のありそうな言語をいくつも、同じように調べるとAPIの制限がキツイので複数の人間で協力するか、長い日数かけてやる必要があると思います。