概要
dc.jsは多次元データを複数のグラフや地図に連携して表示することが可能なJavaScriptのライブラリです。
dc.js - Dimensional Charting Javascript Library
http://dc-js.github.io/dc.js/
たとえば次のようなグラフを描画したとします。
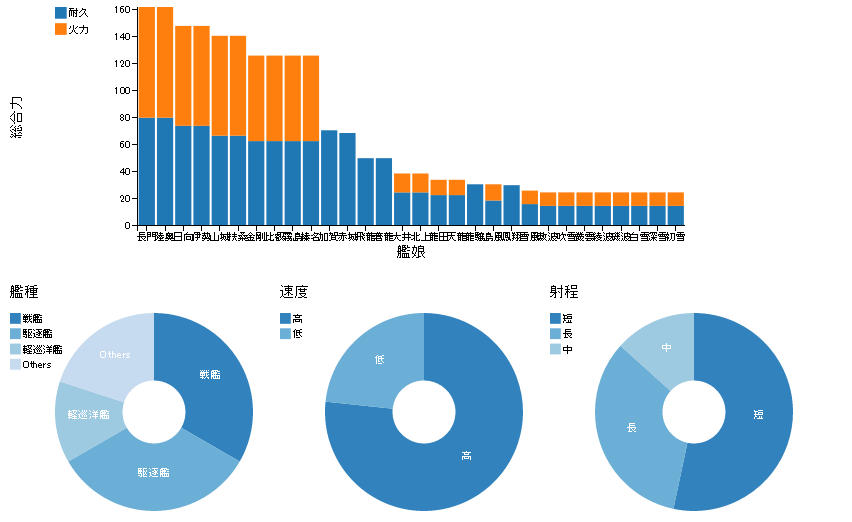
dc.jsを使えば、グラフ上の項目をクリックすることで任意の項目のフィルタリングが行えます。
下記の例では「艦種」が「戦艦」かつ「速度」が「低」の艦を抽出しています。
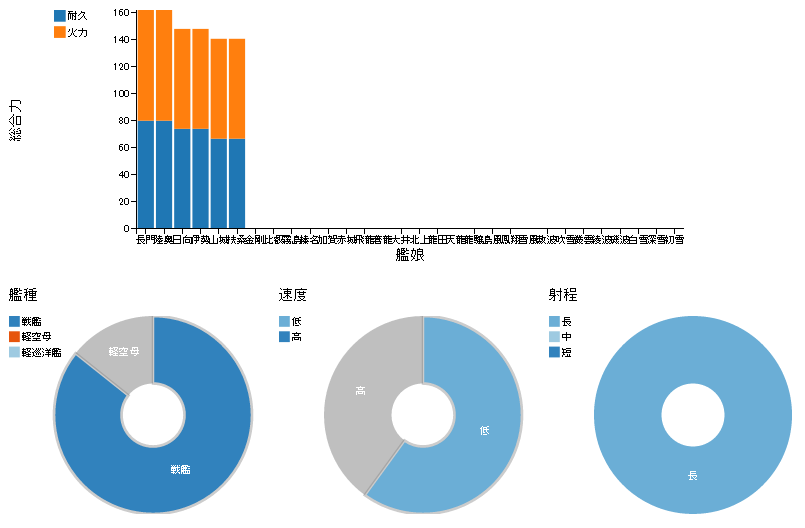
特定の項目をフィルタリングすることにより、全てのグラフが連動して変化していることが確認できます。これによりに、様々な角度でデータを表現することが可能になります。
このサンプルは以下にあります。
http://needtec.sakura.ne.jp/dc_example/exampl001.html
依存ライブラリ
dc.jsは以下のライブラリに依存しています。
・D3.js
・crossfilter.js
D3.js
データに基づいてドキュメントを操作するための JavaScript ライブラリです。D3 はHTML や SVG、 CSSを使ってデータを様々な形で表現することができます。
Data-Driven Documents
http://d3js.org/
日本語ドキュメント
http://ja.d3js.node.ws/
crossfilter.js
Crossfilterはブラウザ上で大きな多変量データを扱うためのJavaScriptのライブラリです。
素早く、グループ化やフィルタリング、データの集約がおこなえます。
github
https://github.com/square/crossfilter
Crossfilterでデータをグループ化したり、フィルターかけたりしてみる
http://qiita.com/mima_ita/items/ba194a2d086c1f67aa7d
サンプルとチュートリアル
ここではdc.jsのサンプルと簡単なチュートリアルを記述します。
使用しているdc.jsは開発版です。
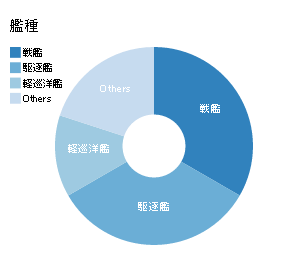
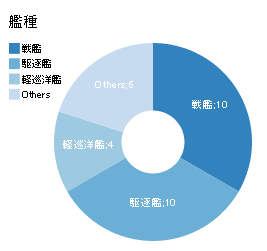
PieChartによる円グラフの例
PieChartは以下のように円でデータの割合を表すグラフです。
このサンプルコードは以下のようになります。
<!DOCTYPE html>
<html lang="en">
<head>
    <title>dc.js - Bar Chart Example</title>
    <meta charset="UTF-8">
    <link rel="stylesheet" type="text/css" href="js/dc.js/dc.css"/>
</head>
<body>

<div id="chart_name"></div>
<div  style="clear:both;"></div>
<div id="chart_type"><p>艦種</p></div>

<script type="text/javascript" src="js/d3/d3.js"></script>
<script type="text/javascript" src="js/crossfilter/crossfilter.js"></script>
<script type="text/javascript" src="js/dc.js/dc.js"></script>
<script type="text/javascript">

var cf = crossfilter([
  {name:"長門", type:"戦艦", speed:"低", range:"長", endurance: 80, fire: 82},
  {name:"陸奥", type:"戦艦", speed:"低", range:"長", endurance: 80, fire: 82},
  {name:"伊勢", type:"戦艦", speed:"低", range:"長", endurance: 74, fire: 74},
  {name:"日向", type:"戦艦", speed:"低", range:"長", endurance: 74, fire: 74},
  {name:"雪風", type:"駆逐艦", speed:"高", range:"短", endurance: 16,fire: 10},
  {name:"赤城", type:"正規空母", speed:"高", range:"短", endurance: 69, fire: 0},
  {name:"加賀", type:"正規空母", speed:"高", range:"短", endurance: 71, fire: 0},
  {name:"蒼龍", type:"正規空母", speed:"高", range:"短", endurance: 50, fire: 0},
  {name:"飛龍", type:"正規空母", speed:"高", range:"短", endurance: 50, fire: 0},
  {name:"島風", type:"駆逐艦", speed:"高", range:"短", endurance: 19,fire: 12},
  {name:"吹雪", type:"駆逐艦", speed:"高", range:"短", endurance: 15,fire: 10},
  {name:"白雪", type:"駆逐艦", speed:"高", range:"短", endurance: 15,fire: 10},
  {name:"初雪", type:"駆逐艦", speed:"高", range:"短", endurance: 15,fire: 10},
  {name:"深雪", type:"駆逐艦", speed:"高", range:"短", endurance: 15,fire: 10},
  {name:"叢雲", type:"駆逐艦", speed:"高", range:"短", endurance: 15,fire: 10},
  {name:"磯波", type:"駆逐艦", speed:"高", range:"短", endurance: 15,fire: 10},
  {name:"綾波", type:"駆逐艦", speed:"高", range:"短", endurance: 15,fire: 10},
  {name:"敷波", type:"駆逐艦", speed:"高", range:"短", endurance: 15,fire: 10},
  {name:"大井", type:"軽巡洋艦", speed:"高", range:"中", endurance: 25, fire: 14},
  {name:"北上", type:"軽巡洋艦", speed:"高", range:"中", endurance: 25, fire: 14},
  {name:"金剛", type:"戦艦", speed:"高", range:"長", endurance: 63, fire: 63},
  {name:"比叡", type:"戦艦", speed:"高", range:"長", endurance: 63, fire: 63},
  {name:"榛名", type:"戦艦", speed:"高", range:"長", endurance: 63, fire: 63},
  {name:"霧島", type:"戦艦", speed:"高", range:"長", endurance: 63, fire: 63},
  {name:"鳳翔", type:"軽空母", speed:"低", range:"短", endurance: 30, fire: 0},
  {name:"扶桑", type:"戦艦", speed:"低", range:"長", endurance:67, fire: 74},
  {name:"山城", type:"戦艦", speed:"低", range:"長", endurance:67, fire: 74},
  {name:"天龍", type:"軽巡洋艦", speed:"高", range:"中", endurance:23, fire: 11},
  {name:"龍田", type:"軽巡洋艦", speed:"高", range:"中", endurance:23, fire: 11},
  {name:"龍驤", type:"軽空母", speed:"高", range:"短", endurance:31, fire: 0}
]);

var dimType = cf.dimension(function(d) {
  return d.type;
});

// 艦種
var gpType = dimType.group().reduceCount();
var chartType = dc.pieChart('#chart_type');
chartType
  .width(300)
  .height(220)
  .cx(160)
  .innerRadius(35)
  .slicesCap(3)    // 上位3種のみ表示し、後はその他とする
  .dimension(dimType)
  .group(gpType)
  .ordering(function(t){
    return -t.value;
  })
  .legend(dc.legend())
chartType.render();

</script>

</body>
</html>
デモ
http://needtec.sakura.ne.jp/dc_example/exampl002.html
API
https://github.com/dc-js/dc.js/blob/master/web/docs/api-latest.md#pie-chart
まずcrossfilterのオブジェクトを作成し、艦種によるdimensionを作成します。
var cf = crossfilter([
  {name:"長門", type:"戦艦", speed:"低", range:"長", endurance: 80, fire: 82},
  // 略
]);

var dimType = cf.dimension(function(d) {
  return d.type;
});
次のコードによって、艦種毎にグループ化を行い、艦種毎の数を集計する関数を指定します。
var gpType = dimType.group().reduceCount();ここまでは、crossfiterが提供する処理です。
このcrossfilterを実際にグラフに描画するコードは次の通りです。
var chartType = dc.pieChart('#chart_type');
chartType
  .width(300)
  .height(220)
  .cx(160)
  .innerRadius(35)
  .slicesCap(3)    // 上位3種のみ表示し、後はその他とする
  .dimension(dimType)
  .group(gpType)
  .ordering(function(t){
    return -t.value;
  })
  .legend(dc.legend())
chartType.render();
まずdc.pieChart()で描画先のdivを指定してオブジェクトを作成し、次にpieChartの設定をおこなってからrender()関数で描画を行います。
主なプロパティの説明は次の通りです。
| プロパティ | 説明 |
|---|---|
| width,heigth | 描画領域の大きさを指定します |
| cx,cy | 円の中心座標を指定します |
| innerRadius | 内部の円の半径を指定します。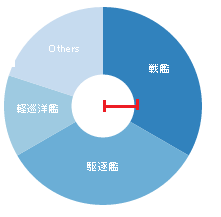 |
| dimension | グラフに関連付けるcrossfilterのdimentionを指定します |
| group | グラフに関連付けるcrossfilterのgroupを指定します |
| ordering | 要素の並び順を指定する関数を指定します |
| slicesCap | グラフに表示する項目の上限を指定します。この上限を超えた場合、Othersに分類されます。 |
| legend | 次のようなサンプルを表示します。 ここで指定できるlegendオブジェクトについては下記を参考にしてください. https://github.com/dc-js/dc.js/blob/master/web/docs/api-latest.md#legend |
グラフ中のラベルの変更方法
labelプロパティに描画用の関数を指定します。
この関数は、ラベルを描画時に、引数にデータを指定して呼び出されます。
chartType.label(function(d) {
  console.log('label', d);
  return d.key + ';' + d.value;
});
なお、引数には以下のようなデータが渡されます。
label Object {key: "戦艦", value: 10}
label Object {key: "駆逐艦", value: 10}
label Object {key: "軽巡洋艦", value: 4}
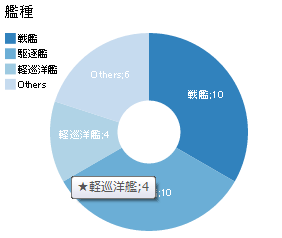
label Object {others: Array[2], key: "Others", value: 6}グラフ中の項目をマウスオーバーした際のツールチップの変更
マウスオーバーでツールチップが表示されますが、そのツールチップを次のようなコードで変更することが可能です。
chartType.title(function(d) {
  console.log('title', d);
  return '★' + d.key + ';' + d.value;
});
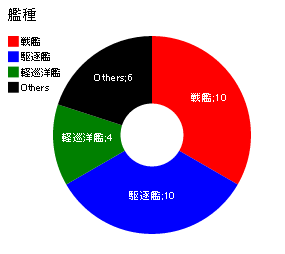
色の変更方法
下記のような実装で、グラフの色を変更できます。
chartType.colors(function(keyName) {
  console.log('color', keyName);
  var pallet = {
    '戦艦' : '#ff0000',    // 6桁のHEX
    '駆逐艦' : '#00f',     // 3桁で表示
    '軽巡洋艦' : 'Green'  //文字で表示
  };
  var r = pallet[keyName];
  if (!r) r = '#000';
  return r;
});
その他、色に関する詳細は下記を参考にしてください。
https://github.com/dc-js/dc.js/blob/master/web/docs/api-latest.md#color-mixin
RowChartによる棒グラフの例
RowChartは以下のようにデータを表現します。
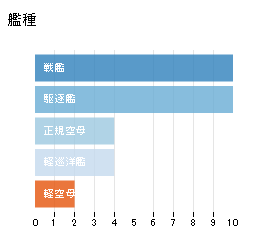
dc.js - Bar Chart Example
艦種